 |
||||||
|
|
|
|
|
|
|
|
| A part of the National Science Foundation Scientific
Database Initiative Grant IRI 9116849 Last updated on April 5th, 2001 |
 |
|
|
Sequence Query
Processing |
|
|
|
Fig. 1 shows the lung
tumor sequence template.
|
|
Query 1: Query Sequence with two images |
 |
|
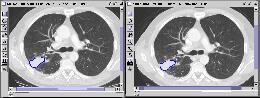
Fig. 2 A query sequence of two CT lung images showing a tumor growing,
constructed from the template in fig 1. |
| Executing the query returns a result viewer window with which we can view the results of the query. | ||||
 | ||||
| Fig. 3 KMeD searches the sequence database with the approximate
matching technique and the best results are returned and shown in the Result
Viewer. The features used for the lung tumor are the distance from the
x and y centroid, and lung tumor area. The features which are
represented in a column. The first four columns represent the features
for the first image, and the next four represent the features of the second
image. The distance is the nearness of the answer sequence with the
target sequence. Each row represents an answer, their ranked according
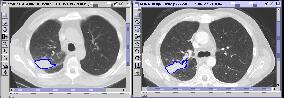
the distance. The corresponding first three image result sequences are
shown in Figure 4. | ||||
| ||||
|
| ||||
|
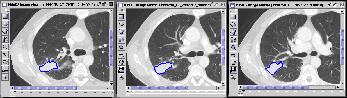
Third query result | ||||
|
Figure 4 | ||||
| Query 2: Query Sequence with three images | ||||
|
| ||||
 | ||||
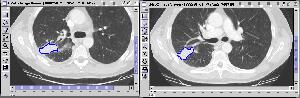
| Figure 5 A query sequence of three CT lung images showing a tumor
growing, constructed from the template in fig 1.
| ||||
 | ||||
| Figure 6 KMeD searches the sequence database with the approximate
matching technique and the best results are returned and shown in the Result
Viewer. The features used for the lung tumor are the distance from the
x and y centroid, and lung tumor area. The features which are
represented in a column. The first four columns represent the features
for the first image, and the next four represent the features of the second
image, and the next four represent the features of the third image.
The distance is the nearness of the answer sequence with the target
sequence. Each row represents an answer, their ranked according the
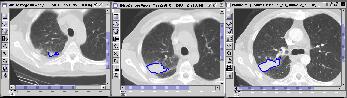
distance. The corresponding first two image result sequences are shown
in Figure 7. | ||||
|
| ||||
|
First Result of Query | ||||
|
| ||||
|
Second Result of Query | ||||
|
Figure 7 | ||||

| ||||
| Return to the previous KMeD page |